Spectra of Activity Explained
The ubiquitous Sanford Guide Spectra of Activity dates back to our first edition in 1969. While the primary organization of the spectra is the same, you'll find many new features (and a multitude of new pathogens and drugs) in our digital Spectra of Activity. This page explains those features and how to maximize the utility of this rapid reference tool.
How to use the Spectra of Activity
The Sanford Guide Spectra of Activity table is available for antibacterial, antifungal, and antiviral agents, and is included in both the Sanford Guide mobile app and Web Edition. You can find them under the Tables and Tools menu.
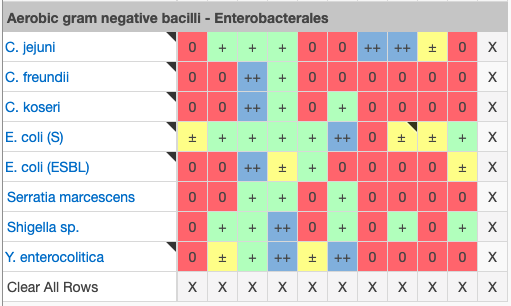
When you load the Antibacterial Spectra of Activity for the first time, you will be presented with a data set of over 7,500 interactions between pathogens and anti-infective agents.
Using the "X" buttons at the bottom and side, you can remove drugs and pathogens that you do not often encounter. You can also click "Clear All Rows" or "Clear All Columns" and set up your own view from scratch as shown below.
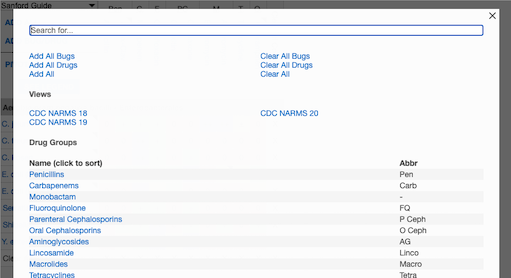
Likewise, you can add drugs and pathogens by tapping "Add Bug/Drug" at the top left and then selecting the individual items or groups you would like to add to the spectra.
As you customize the table, your changes will be saved on your device, and will become your new default view.
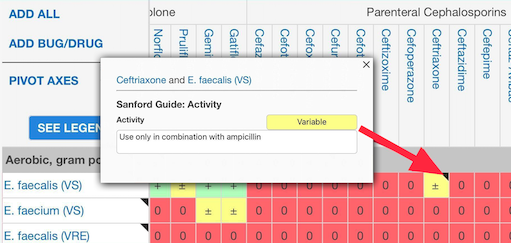
Any time you see a black triangle at the corner of the box containing an interaction, drug name, or pathogen name, you can click or tap on that box to get additional concise information. For comprehensive information about a drug or pathogen, click the blue hyperlinks on the spectra screen or pop-up window.
Frequently Asked Questions
I am practicing outside of the United States. Can I apply the information found in the Spectra of Activity Table to my local practice?
The data in the Spectra of Activity Table are intended to serve as a general guide to antibacterial usefulness based on treatment guidelines and recommendations, in vitro activity, predominant patterns of susceptibility or resistance and/or demonstrated clinical effectiveness. Variability in resistance patterns due to regional differences or as a consequence of clinical setting (e.g., community-onset vs. ICU-acquired infection) should be taken into account when using this table because activities of certain agents can differ significantly from what is shown in the table, which are by necessity based on aggregate information.
Where can I find information about rare/unusual pathogens?
A page with less common bacteria that tend to be rare pathogens, normal human flora, environmental contaminants, often non-pathogenic and of low virulence, and present in mixed cultures is available. This page, Bacteria: Normal Floral, Non-pathogenic, Contaminants, Rare Pathogens, can be found by navigating to the Pathogen Menu, under Bacterial Organism, A-B. Alternatively, searching for any of the terms in the page title will also bring you to that page.
What is the best way to find information about penetration at the site of action as some drugs are active, but need to get to the site of action?
Information about pharmacologic parameters such as these can be found in the Pharmacologic Features of Antimicrobial Agents table located in the Tables & Tools menu on the Web Edition and from the Home screen of the mobile app. This information can also be found on our individual anti-infective pages.
Can you provide highlights like pearls of antibiotic usage?
This information can be found on our anti-infective pages under usage and dosage. You may also find this information on syndrome or pathogen pages under the Antimicrobial Stewardship or Comments sections.
Can you add newer drugs?
New agents are added once approved by the United States Food and Drug Administration (FDA) or the European Medicines Agency (EUA). A recent example is sulbactam-durlobactam which was recently FDA approved. These agents may or may not appear on the Spectra of Activity table depending on their activity. In the case of sulbactam-durlobactam, which has been approved to treat certain infections caused by Acinetobacter baumannii-calcoaceticus complex, it will not be added to the Spectra of Activity table at this time due to its limited activity.